REMI Economic Models
Tax-PI

Turn tax policy into measurable outcomes.
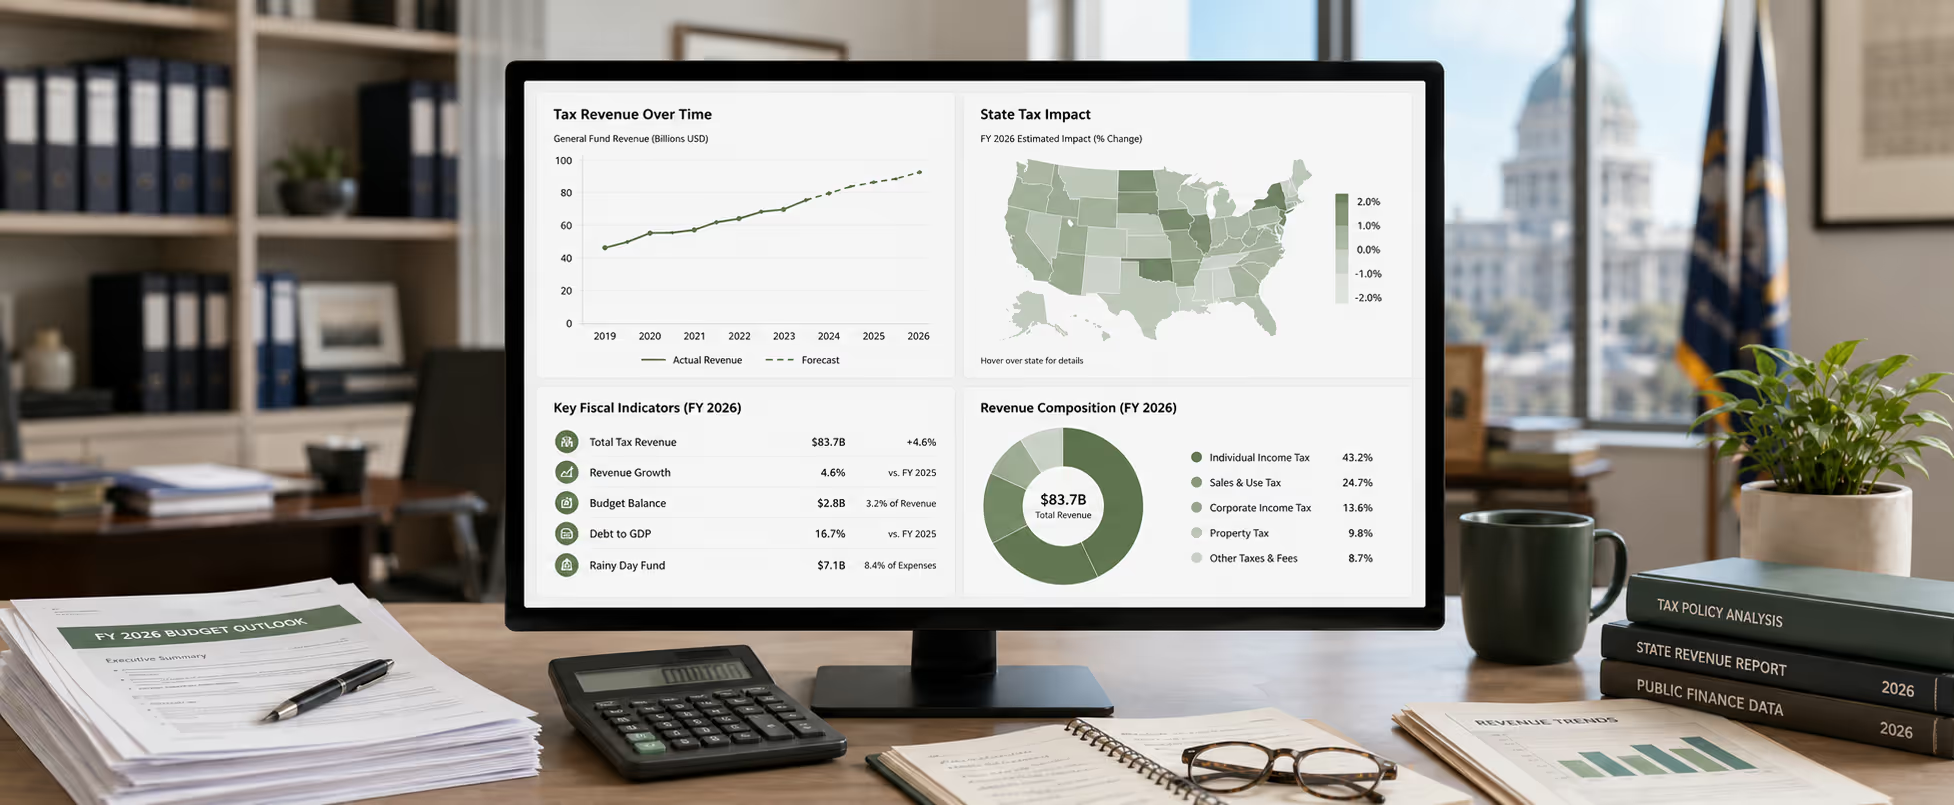
Tax-PI shows both the economic and fiscal effects of tax and policy changes—pairing the REMI model with a customizable government budget so you can forecast revenues, score legislation, and build state and local budgets with confidence.
WHAT Tax-PI HELPS YOU ANSWER
Better questions.
Smarter fiscal policy.
Tax-PI turns tax and budget decisions into clear economic and fiscal answers—so you can score proposals, compare scenarios, and demonstrate the long-term effects of policy on your economy and your budget.
How will a tax change affect revenue?
Project state and local revenue year by year, accounting for the economy's dynamic response.
What is the economic impact of a tax policy?
Estimate the effect on jobs, output, income, and population across industries and regions.
How does a policy affect the state budget?
See how changes ripple through revenues and expenditures to shape the overall fiscal balance.
What is the true cost of an incentive?
Weigh the economic benefits of tax credits and incentives against their net fiscal cost over time.
Which regions and industries are affected?
Identify the geographies and sectors that gain or lose under different tax scenarios.
How do scenarios compare to a baseline?
Compare alternative tax and spending scenarios against a baseline to isolate the policy's true impact.
Case Studies
Proven results.
Real-world impact.
Organizations across the public and private sectors rely on Tax-PI to evaluate policy choices, compare scenarios, and plan with confidence—delivering measurable economic and policy outcomes.
VIEW ALL STUDIES

Tax and Fiscal
Proposal to Replace School Property Taxes
The Pennsylvania Independent Fiscal Office (IFO) utilized the REMI model to evaluate a proposal to eliminate school district property taxes and replace the revenue with increases i…
Read study
Tax and Fiscal
Nevada County Population Projections 2025 to 2044
Every year, the Nevada State Demographer at the Nevada Department of Taxation uses the REMI model to forecast 20-year population projections for Nevada and its counties. For the 20…
Read study
Consulting & Advising
Economic and Fiscal Impacts of Medicaid Expansion Reversal in Ohio
The “One Big Beautiful Bill” passed recently by the House of Representatives significantly cuts federal funding for Medicaid. It is uncertain how these cuts will affect the program…
Read study
See how Tax-PI can help you answer important questions and drive better outcomes.
TALK TO AN EXPERTHOW Tax-PI WORKS
From tax policy to
economic and fiscal impact.
Tax-PI connects tax and budget decisions to economic and fiscal outcomes through a transparent process trusted by state revenue departments, legislative budget offices, and fiscal analysts across the country.
Set up your budget & tax structure
Customize the government budget—revenue sources and expenditure categories—to mirror your state or locality.
Define the policy & run the model
Specify the tax or spending change and Tax-PI simulates the full economic and fiscal response with the PI+ engine—year by year.
Review economic & fiscal results
Explore impacts on jobs, output, and income alongside revenues, expenditures, and the budget balance against a baseline.
Built on PI+
The same trusted economic engine, extended with a dynamic fiscal layer.
Customizable Budget
Tailor revenues and expenditures to match your state, county, or locality.
Dynamic Scoring
Captures how the economy's response feeds back into revenues and budgets.
Trusted by Budget Offices
Used by state revenue departments, legislatures, and fiscal analysts.
KEY OUTPUTS / CAPABILITIES
Comprehensive results.
Clearer fiscal decisions.
Tax-PI delivers the full range of economic and demographic outputs—plus the fiscal detail of revenues, expenditures, and budget balances—so you can understand the complete impact of every tax and policy choice.
Tax Revenue
Forecast revenue by source—income, sales, property, and corporate taxes—year by year.
Budget Balance
Track the net fiscal effect on revenues, expenditures, and the overall budget over time.
Employment
Measure total jobs and job changes by industry across the region.
Output / GDP
See impacts on industry output, value added, and real gross regional product over time.
Personal Income
Track changes in personal income and earnings.
Population
Project population and migration shifts driven by tax and policy changes.
Industry Output
Evaluate industry-specific impacts across detailed sectors and supply chains.
Government Expenditures
Model how spending categories respond to changing populations, prices, and revenues.
All outputs are available year-by-year, by industry, and across local, state, and national geographies— so you can show the full economic and fiscal story of every policy.
APPLICATIONS
Real-world policies.
Stronger fiscal cases.
Tax-PI helps revenue departments, legislatures, and fiscal analysts evaluate the economic and fiscal effects of tax and budget decisions. See how our clients use Tax-PI to score proposals, forecast budgets, and inform policy.

HOW TAX-PI IS USED
Tax Policy Analysis
Score the economic and fiscal effects of changes to income, sales, property, and corporate taxes.

Budget & Revenue Forecasting
Build multi-year revenue and budget forecasts that account for the economy's dynamic response.

Incentives & Credits
Evaluate the net fiscal cost and economic return of tax credits, incentives, and abatements.

Education & Infrastructure Investment
Assess how public investments funded through the budget affect the economy and future revenues.

Economic Development
Compare the fiscal and economic tradeoffs of development strategies and business attraction.

Legislative & Fiscal Notes
Produce credible, dynamic fiscal estimates to support legislation and budget deliberations.

From statewide tax reform to local budget decisions, Tax-PI gives you the insight to make evidence-based fiscal choices that drive meaningful impact.
VIEW RELATED STUDIESUsed by leaders across the
public and private sector.
For more than 40 years, REMI has partnered with organizations at every level to deliver credible analysis and better economic outcomes.
 Alaska Dept. of Revenue
 Illinois Dept. of Commerce
 Louisiana Dept. of Revenue
 Massachusetts Dept. of Revenue
 National Education Association
 Texas Legislative Budget Board
 Washington State Legislature
See Tax-PI on your own budget and tax questions.
Request a demo to explore Tax-PI with your own scenario, or compare it against the rest of the REMI suite.
Every REMI model includes professional training and unlimited technical support.