REMI Economic Models
PI+
Model policy impact before decisions are made.
PI+ delivers year-by-year economic and demographic forecasts that show how policy choices ripple through communities, industries, and people—so you can lead with confidence.
WHAT PI+ HELPS YOU ANSWER
Better questions.
Stronger policy outcomes.
PI+ turns complex economic dynamics into clear, actionable answers—so you can confidently evaluate policy options, compare scenarios, and plan for what comes next.
How many jobs will be created or lost?
Estimate total employment impacts across industries and regions.
Which industries gain or lose output?
See how policy changes affect industry output and economic contributions.
How does personal income change over time?
Measure changes in personal income and purchasing power over time.
Which regions see the greatest impact?
Identify geographic areas with the strongest positive or negative effects.
What happens to population and labor force?
Understand shifts in population, participation, and labor market dynamics.
How do results compare to a baseline scenario?
Compare outcomes to a baseline to isolate policy drivers and tradeoffs.
Case Studies
Proven results.
Real-world impact.
Organizations across the public and private sectors rely on PI+ to evaluate policy choices, compare scenarios, and plan with confidence—delivering measurable economic and policy outcomes.
VIEW ALL STUDIES
Tax and Fiscal
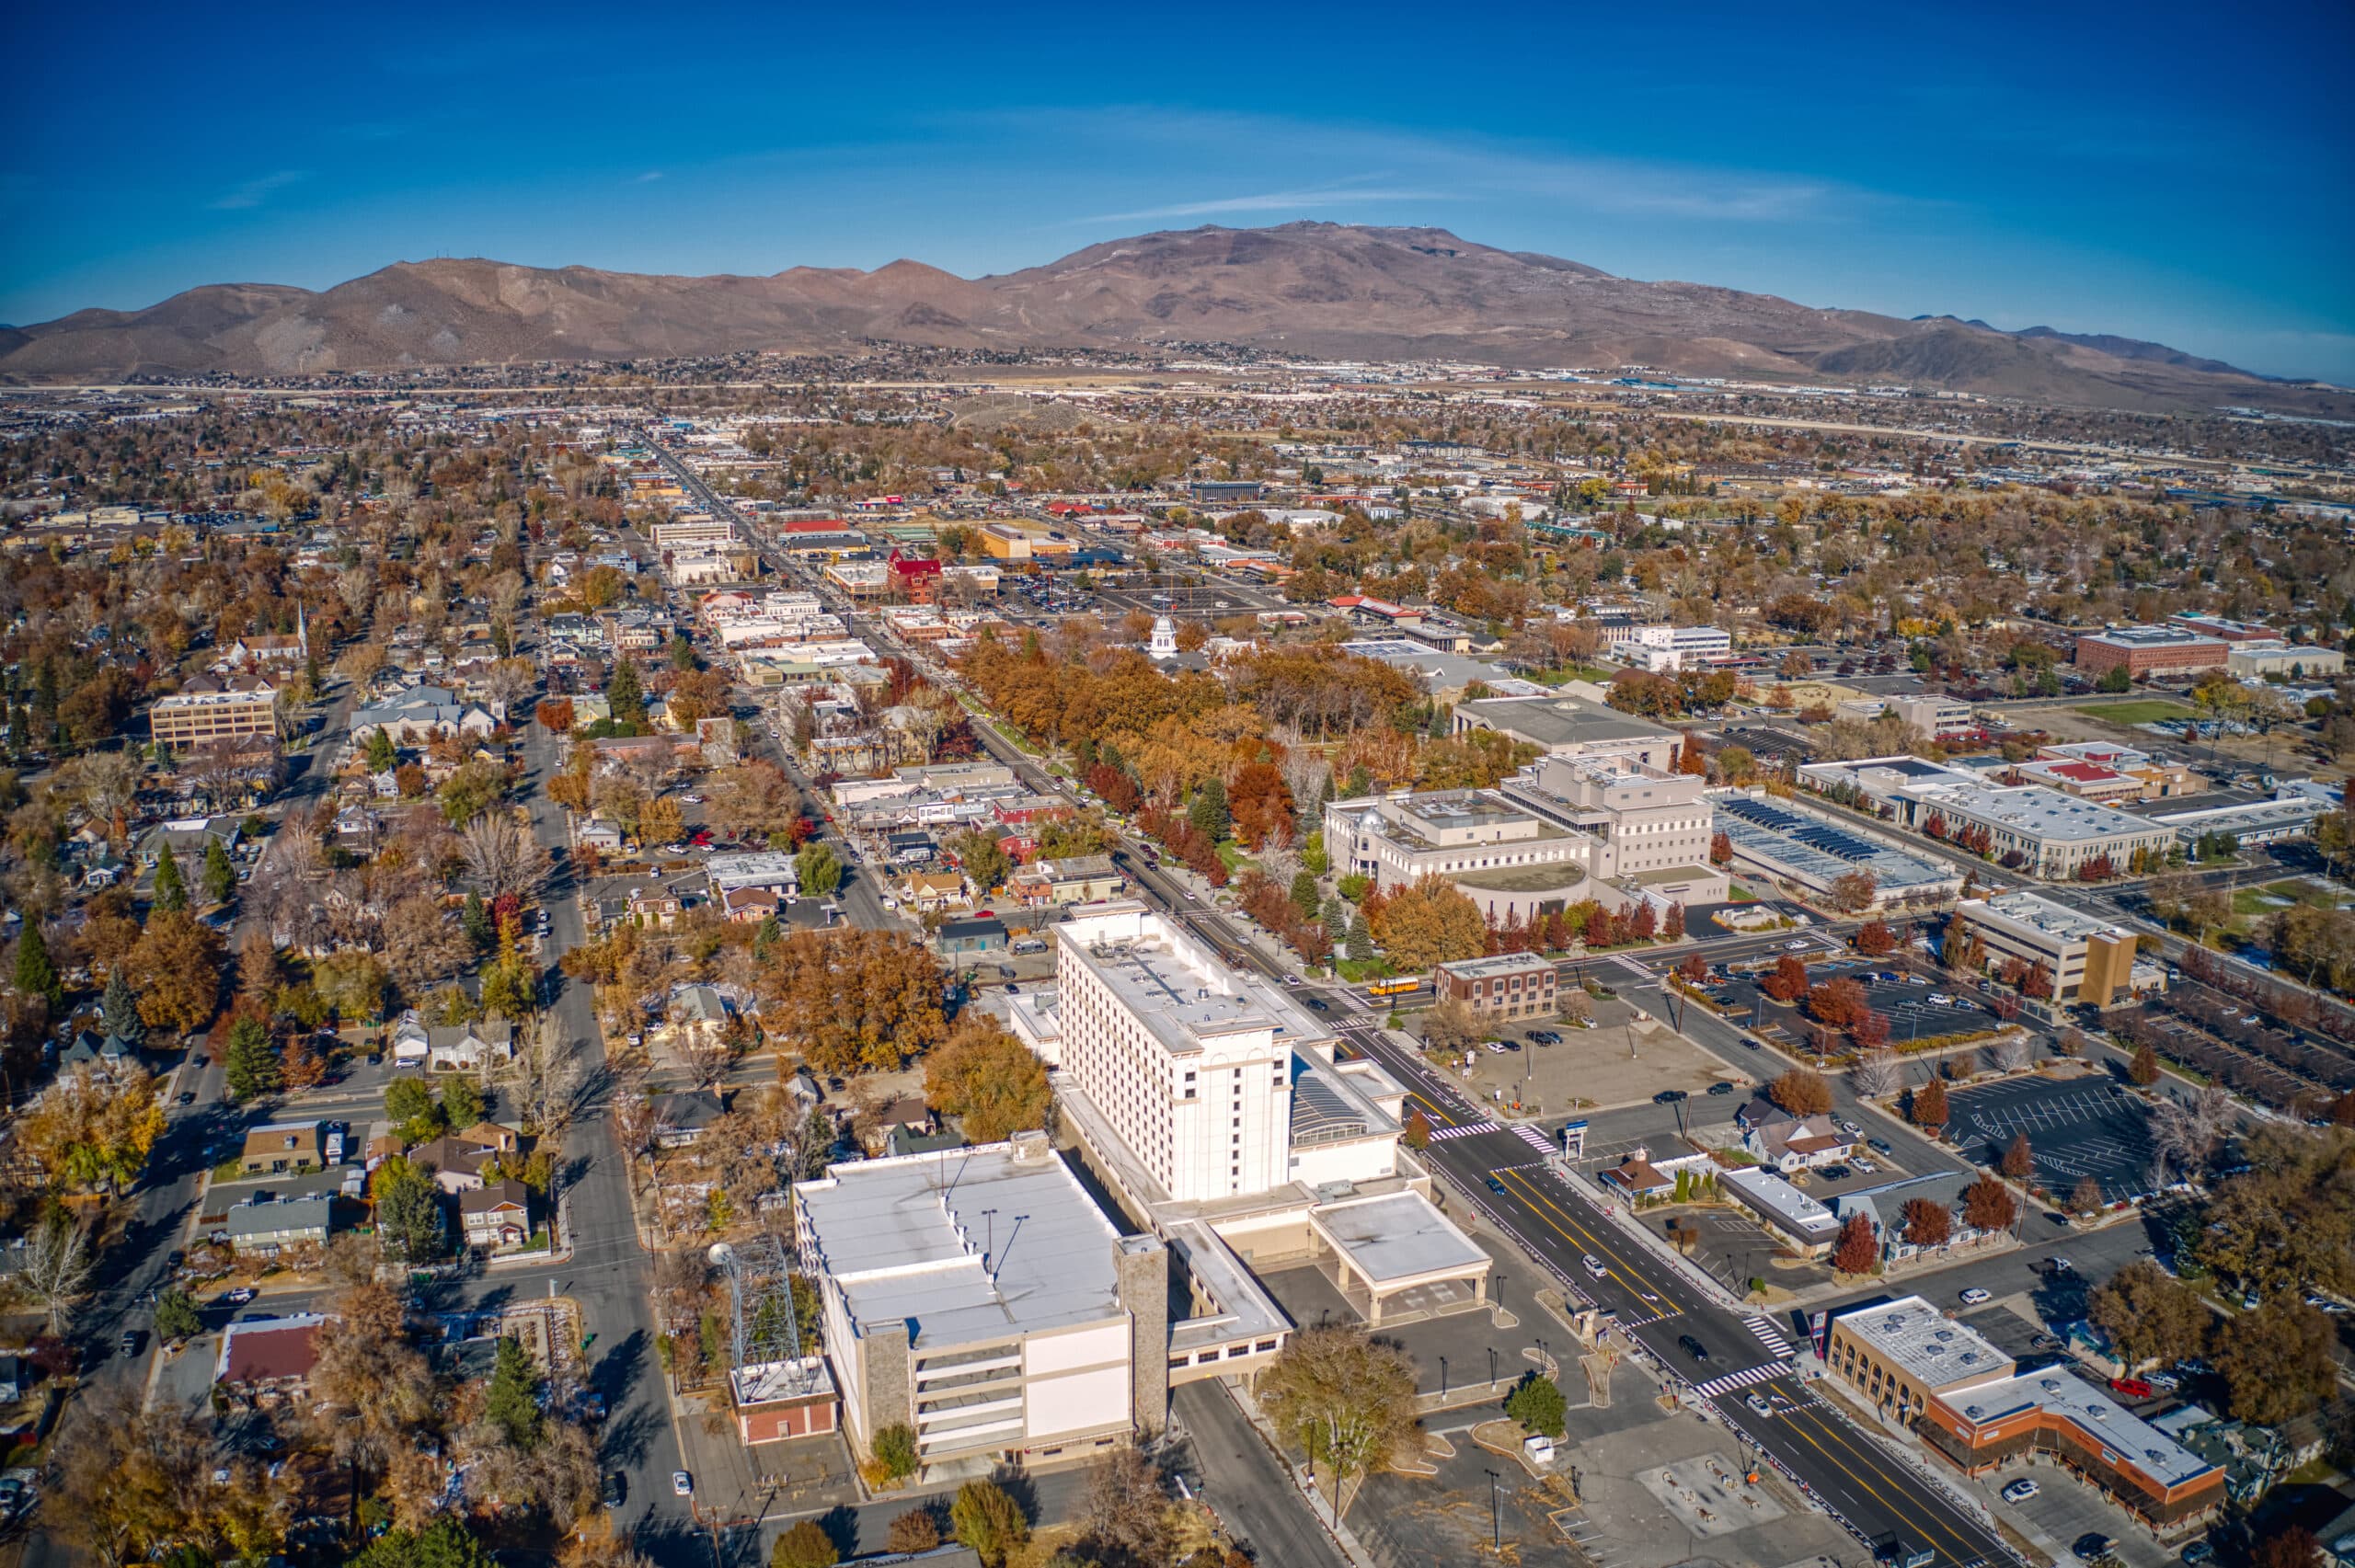
Nevada County Population Projections 2025 to 2044
Every year, the Nevada State Demographer at the Nevada Department of Taxation uses the REMI model to forecast 20-year population projections for Nevada and its counties. For the 20…
Read study
Transportation
Kansas Advanced Air Mobility Strategy
Multiple organizations in Kansas, as well as MITRE Corporation, all collaborated to conduct the 2025 Kansas AAM (Advanced Air Mobility) economic impact study. AAM is an emerging te…
Read study
Energy and Environment
New York’s Nuclear Fleet Economic Impact Report
Carbon Free New York commissioned The Brattle Group to conduct an impact report focused on New York’s nuclear power fleets. The nuclear power centers included in this study are the…
Read study
See how PI+ can help you answer important questions and drive better outcomes.
TALK TO AN EXPERTHOW PI+ WORKS
From policy change to
measurable impact.
PI+ links policy decisions to economic outcomes through a transparent, rigorous process trusted by government agencies and research institutions across the country.
Define the policy change
Specify the policy, affected region, and key assumptions to establish a clear, repeatable scenario.
Run the economic model
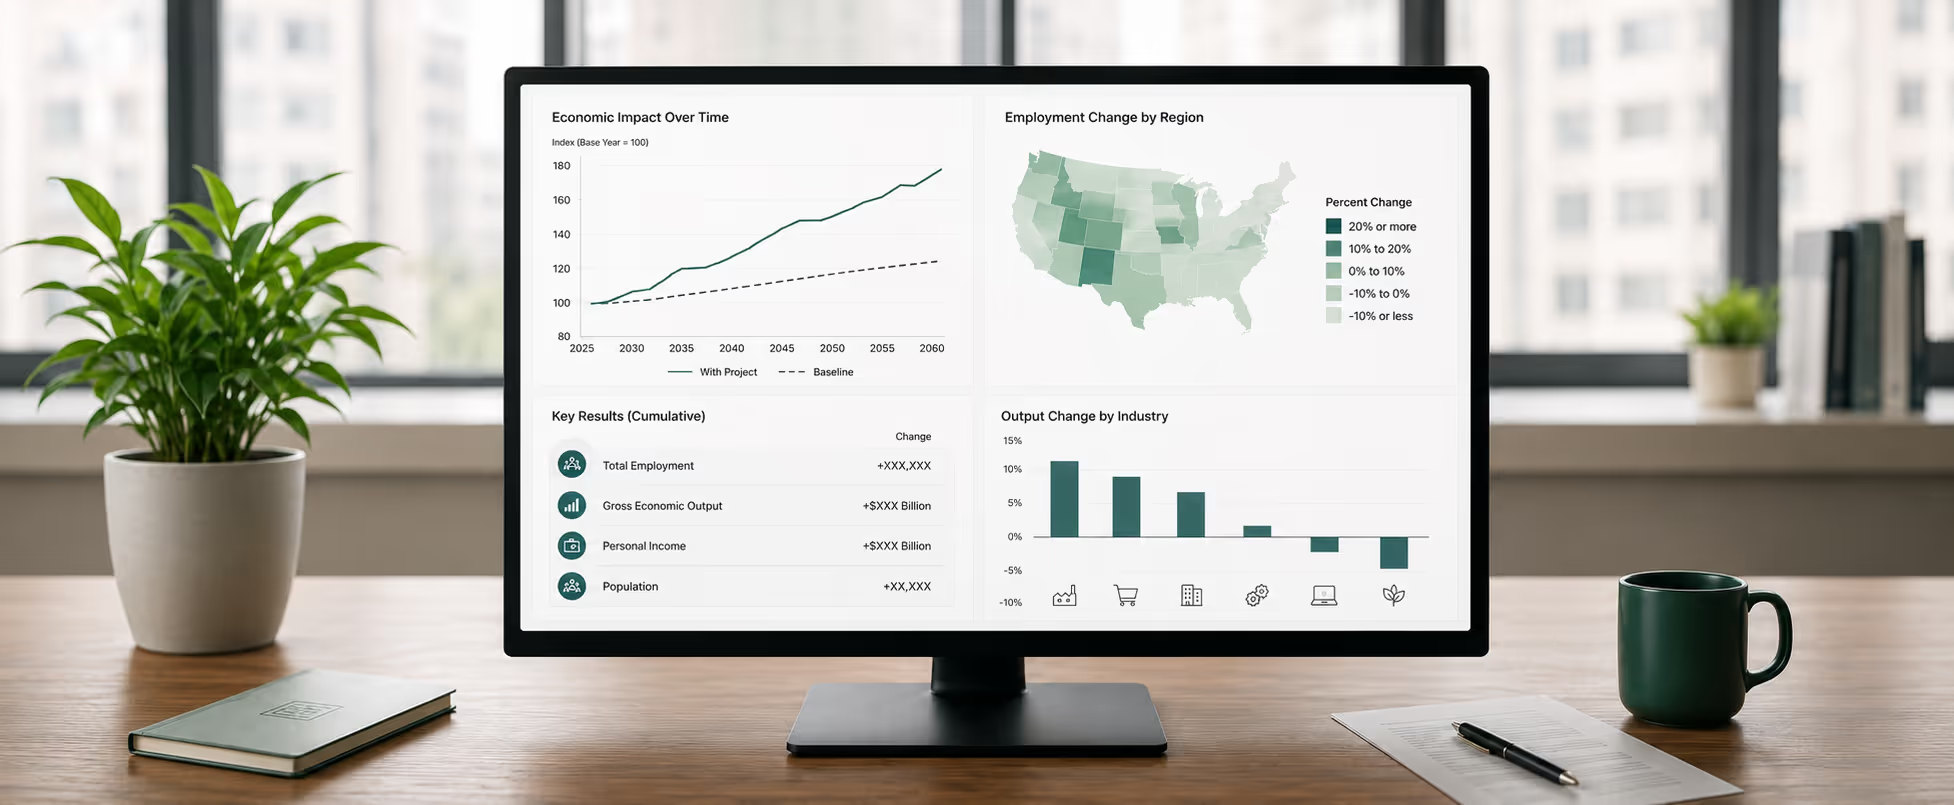
PI+ simulates how the change ripples through industries, households, and governments—year by year.
Review projected impacts
Explore results across jobs, output, income, and population for any geography and time horizon.
Transparent & Repeatable
Clear assumptions, consistent methodology, results you can defend.
Comprehensive Coverage
Captures direct, indirect, and induced effects across the full economy.
Actionable Insights
Results structured for real-world decisions, presentations, and publications.
Trusted by Leaders
Used by federal agencies, state governments, universities, and private firms.
KEY OUTPUTS / CAPABILITIES
Comprehensive results.
Clearer decisions.
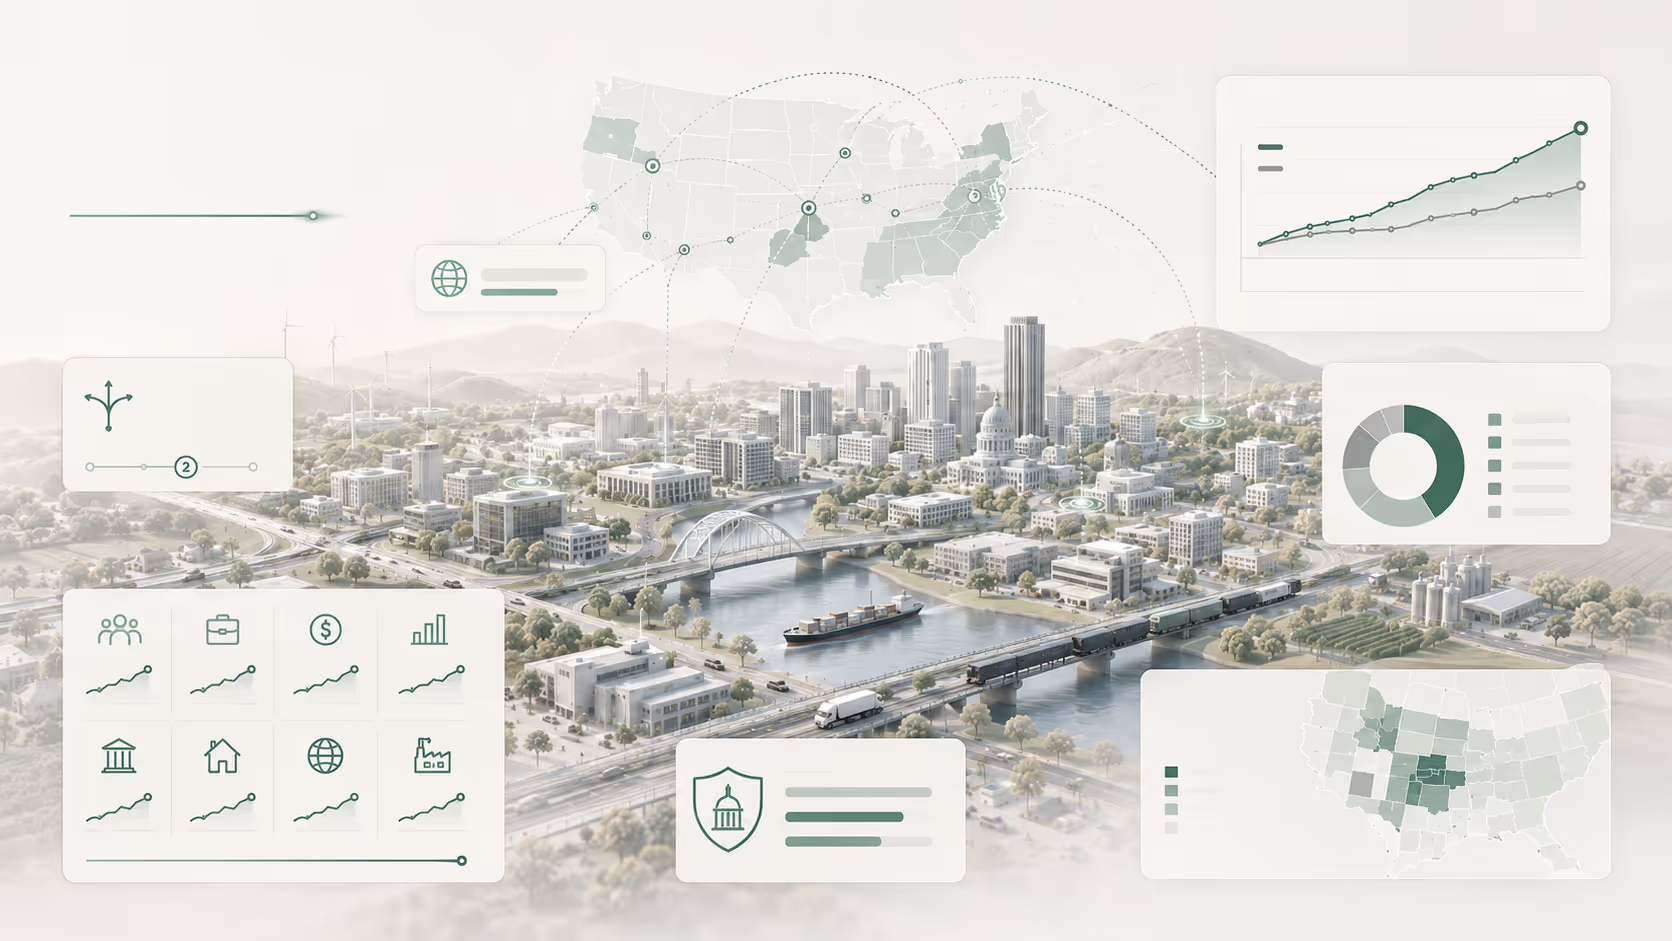
PI+ delivers a wide range of economic and demographic outputs—in one integrated model—so you can understand the full impact of policy choices with confidence.
Employment
Measure total jobs, job changes by industry, and labor demand across sectors and regions.
Output / GDP
See impacts on industry output, value added, and real gross regional product over time.
Personal Income
Track changes in personal income and earnings.
Population
Project population changes by age, cohort, and demographic characteristics.
Labor Force
Analyze labor force participation, employment by occupation, and workforce availability.
Industry Output
Evaluate industry-specific impacts across detailed sectors and supply chains.
Wages & Earnings
Assess wage rates, compensation, and total earnings by industry and occupation.
All outputs are available year-by-year, by industry, and across local, state, and national geographies— so you can analyze today's decisions and tomorrow's outcomes.
APPLICATIONS
Real-world decisions.
Stronger outcomes.
PI+ helps organizations across the public and private sectors evaluate policy choices, compare scenarios, and plan with confidence. See how our clients use PI+ to solve complex economic and policy challenges.

HOW PI+ IS USED
Economic & Fiscal Impact Analysis
Evaluate the economic, fiscal, and distributional effects of legislation, regulations, and public investments.

Regional & Community Planning
Understand how policies and investments affect local economies, industries, and communities.

Workforce & Labor Market Analysis
Assess changes in labor demand, occupations, and workforce availability across industries and regions.
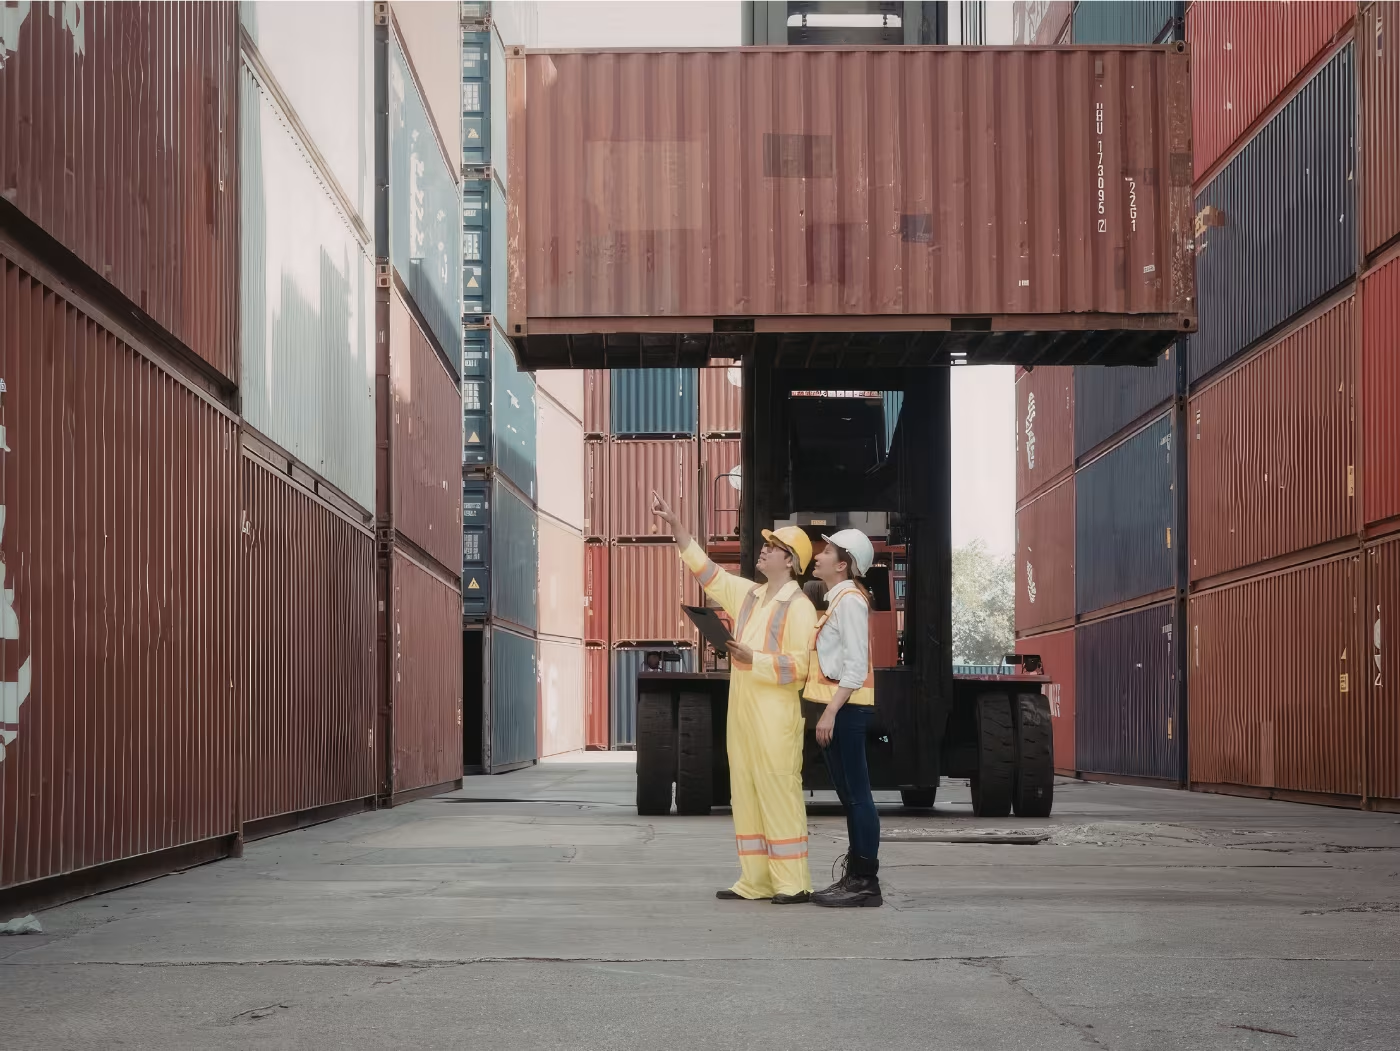
Industry & Investment Strategy
Identify industry impacts, supply chain effects, and investment opportunities under different scenarios.

From national policy to local projects, PI+ gives you the insight to make evidence-based decisions that drive meaningful impact.
VIEW RELATED STUDIESUsed by leaders across the
public and private sector.
For more than 40 years, REMI has partnered with organizations at every level to deliver credible analysis and better economic outcomes.
 Arizona State University
 Clemson University
 Illinois Dept. of Commerce
 South Coast AQMD
 Texas Comptroller
 Washington State Legislature
See PI+ on your own policy questions.
Request a demo to explore PI+ with your own scenario, or compare it against the rest of the REMI suite.
Every REMI model includes professional training and unlimited technical support.