
Why REMI
Forecast the baseline.
Measure the difference.
REMI combines long-range economic and demographic forecasting with dynamic economic modeling. First, the model projects how a region is expected to evolve under current conditions—the baseline. It then models that same economy with a policy, investment, or project in place. The difference between those two paths is the economic impact.
This is a schematic, not a forecast. The size and timing of a real impact depend on the region, the policy, and the assumptions behind it.
The REMI Forecast
Walk the path ahead.
Compare what changes.
An impact isn’t one headline number — it’s a path. Each model reports the difference between baseline and scenario year by year up through 2060, across jobs, output, income, and population, so you can see when an effect arrives, how large it gets, and how long it lasts.
- Year-by-year results
- Baseline vs. scenario
- Forecasts through 2060
Published Study
Regional Jobs Generated by the Gateway ProgramNew York & New Jersey
Step through the years: construction jobs peak in the mid-2030s, then commuting and productivity benefits carry the total once the tunnel opens in 2045.
Checkpoint year: 2060
- O&M Spending Benefits
- Productivity Benefits
- Commuting Benefits
- Gateway Full Build Scenario / Phase 2
- Gateway Full Build Scenario / Phase 1
- Supporting Projects - Construction
Modeled in REMI TranSight by Regional Plan Association and WSP USA: The Economic Promise of the Gateway Program. The chart plots the New York and New Jersey region; the study’s average of 46,100 jobs is the national total.
Dynamic Economic Modeling
Make one change.
Watch the response.
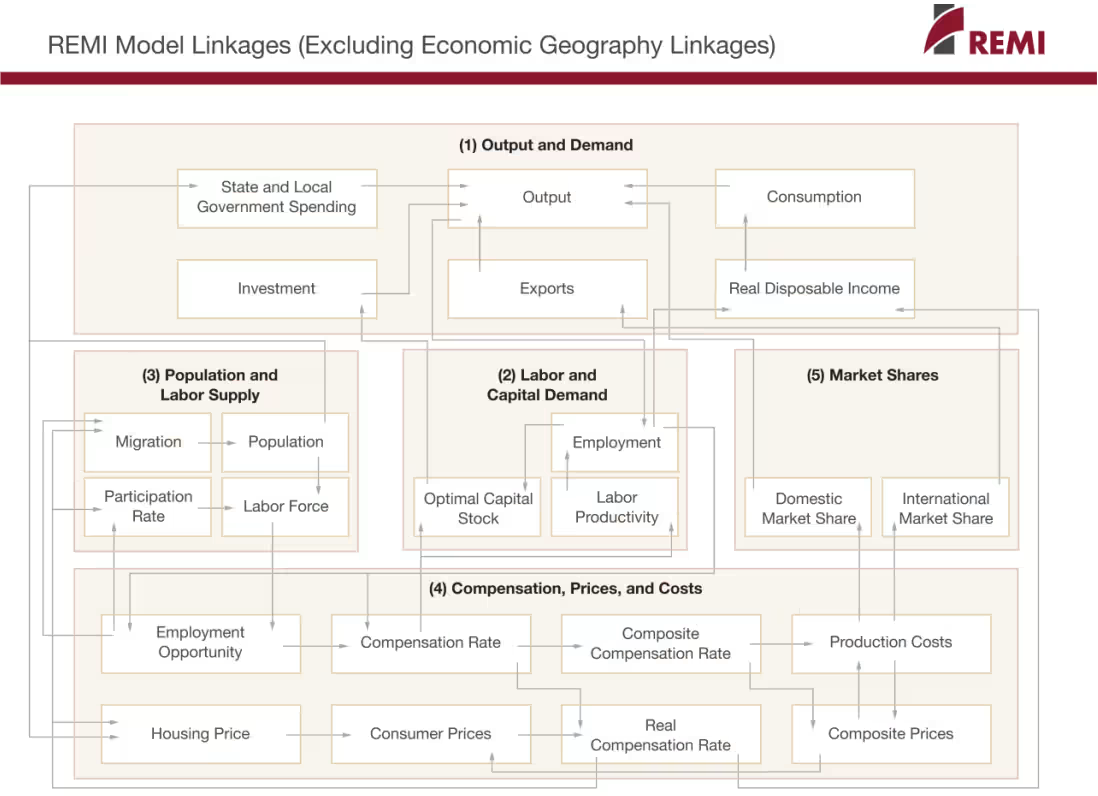
A change in one part of the economy creates responses in the others. Employment affects population, population shifts demand, and demand moves output, prices, and trade. Rather than holding those relationships static, REMI models how they interact and evolve over time.
- Five linked blocks
- Feedback every year
- No fixed multipliers
Output & Demand
Balances supply and demand across the economy — output, consumption, investment, government spending, imports, and exports.
Labor & Capital Demand
Sets employment and capital stock from output, wage rates, and the cost of capital, industry by industry.
Population & Labor Supply
Tracks migration, population, and labor force participation as economic opportunity shifts between regions.
Compensation, Prices & Costs
Follows wages, consumer and housing prices, and production costs as they adjust to the changes above.
Market Shares
Turns production cost into each industry's domestic and international market share — which feeds back into output and demand.
Bring your question to the model.
Tell us the policy, the geography, and the timeline. We’ll point you at the model built for it — or tell you if there’s a simpler way to get your answer.